 |
December 2005 |
E-News Update |
|
|
In This Issue |
|
||||
|
|
NIATx Presentations |
|||||
|
||||||

Jamie was only 22 but her life had become a downward spiral of domestic abuse and addiction to methamphetamine. One fateful rainy day Jamie looked for help in the telephone book and found STEP 2, a program in Reno, Nevada, that provides addiction treatment services to women. STEP 2 gave Jamie the opportunity to get off methamphetamine and provided the appropriate mix of treatment services, support, and encouragement she needed to maintain a drug-free lifestyle. At STEP 2, Jamie completed treatment for her addiction and received prenatal care and parenting education. She continued her education and set up an independent and respectable life for herself and her two young sons. Jamie was also instrumental in setting up an alumni group for STEP 2 graduates. Her story is one of a life that was truly transformed. READ MORE...
.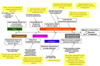
Though it seems clear that the five principles promote success, how to apply these principles in practice is not so clear. We can use visual modeling tools to implement the five principles, because they allow us to map out the system and infer cause and effect, generate ideas and solutions, and manage the change process better. Read more about the 10 VISUAL MODELING TOOLS (basic flowcharts, swimlane diagrams, fishbone diagrams, inter-relationship digraph, iBoards, i2 charts, sociograms, spiderwebs, Tug-O-War diagrams, WWW charts) that facilitate process improvement.