
- Home
- About
About Us
Contact
How to Get Involved
Stay Connected

Sign-up for the NIATx E-News

Stay connected with the monthly NIATx E-News, latest updates, and upcoming events.
Follow Us


- Resource Center
Using NIATx
Getting Started
- The NIATx Model
- NIATx Process Improvement 101 Your starting point for learning the NIATx Way to process improvement.
Step-By-Step Guides
Tools and Support
- Promising Practices Successful changes that have been tested in the field.
- Process Improvement Toolbox How-to guides and other tools to help your change project.
- NIATx Glossary
Health Care Resources
- Buprenorphine Implementation ToolkitAn overview of how organizations can use NIATx practices and tools to implement or improve a buprenorphine treatment program.
- Third-party Billing Guide Create a billing system at your agency.
- Getting Started with Medication Assisted Treatment Implement a Medication-Assisted Treatment program at your agency.
- Health Reform Readiness Index Assess your organiztion's readiness for health reform.
- Health Reform Resources Information and resources to help you prepare for health reform.
- NIATx Initiatives
Current Initiatives See all
- Training/Events
Training
Change Leader Academy
- The Change Leader Academy will equip you to lead change projects and teams within your organization.More information
BHbusiness: Mastering Essential Business Operations (external site)
- SAMHSA sponsored training and support for behavioral healthcare executives, CEOs, and directors.Visit the BHBusiness website to find out more
Webinars
Marketing with Social Media
- Mayo Clinic's Fabulous Social Media Applications
- Social Media Campaigns - An Overview
- Tips on Designing a Web Page
- Marketing Your Mission Through Social Media
- View recordings of the webinars
- Support
NIATx Support
The ATTC/NIATx BlogSee all
Discussion Forum
- Where NIATx users can get help from over 4000 provider participants, 100 coaches and university staff.View the forum
Instant Help
- Advice from NIATx experts on frequently asked questions.Visit Instant Help
NIATx Coaches
My NIATx
My NIATx is your dashboard for accessing the NIATx network. Update your account information, organize your saved links or documents and view the latest News, Blog and Discussion Forum topics.
- Success Stories
Process Improvement Toolbox
- How to Perform a Walk-through
- How to Use the Nominal Group Technique
- Rapid-cycle testing: How to Conduct a Plan-Do-Study-ACT (PDSA) Cycle
- How to Flowchart
- How to Tell a Story
- How to Collect Data
- How to Establish a Change Team
- Visual Modeling Tools
- Creativity and Design
- Sustainability Model
- Getting Things Done
- Essential Team Behaviors
- Using Metaphors to Explore Continuous Improvement
- The Improvement Cafe
- Health Reform Readiness Index
- Technical Assistance Reports
- Recursos en Español
How to Collect Data
Q. How will you rapidly know a change is an improvement?
A. Data
As you go about making changes in your organization, a few questions will naturally arise:
- How will you know which changes worked, and which did not?
- How will you know which changes resulted in an improvement?
- Which changes are the most important and resulted in the greatest improvement?
By collecting data before, during, and after the change you implement, you can measure, evaluate, and compare your agency’s progress with respect to the goals you set out. The process of measuring change should speed the improvement process; you should begin with simple measures rather than spending time developing a complex measurement system.
Measuring the impact of change is an important aspect of successful organizational improvement. These steps are designed to help guide your agency in the timely and accurate measurement of change.
- Define Your Measures
- Collect Baseline Data
- Establish a Clear Aim
- Consistently Collect Data
- Chart Your Progress
- Ask Questions
Define Your Measures
Change Teams establish clear measures and definitions prior to the start of a change project. The measures should clarify the project objectives and should be agreed upon by key stakeholders.
Think about what results you would see. For example:
- If the aim is to increase initial patient use of a service or treatment, count the number of patients who start each month.
- If the aim is to increase continued patient use of a service or treatment, count the number of uses per patient within a fixed period of time (e.g., number of treatment sessions per month).
- If the aim is to reduce waiting time from the 1st contact to the 1st treatment, count the number of days each patient waits, or ask “How many days until the next available appointment for an assessment? for 1st treatment appointment?
- If the aim is to reduce missed appointments, calculate the percent of appointments that are not kept .
Collect Baseline Data
Never start a change process without collecting baseline data. In doing so, you should clearly define a starting point for the change and work backwards to collect two to three months of baseline data before making any changes. This process anchors the change (pre-change) and enables your agency to measure the impact of the change over time (post-change). Baseline data should be collected using agreed upon measure definitions. More importantly, the collection of baseline data allows an agency to answer four questions and make adjustments as necessary:
- Was the data defined to ensure that we collect exactly the information needed?
- How accurate is the data? Does accuracy matter?
- Does the process ensure that the measures will be collected consistently?
- Do trade-offs exist? Is quality more important than the time required to collect data?
Establish a Clear Aim
Establish a clear improvement aim or target (e.g., reduce client no-shows from 65 percent to 25 percent). Such a target should:
- Be realistic yet ambitious (e.g., do not expect 100 percent treatment completion)
- Be linked to project objectives
- avoid confusion, especially with percentages (e.g., say improve no-shows from 65 percent to 25 percent, rather than improve no-shows by 62 percent).
Remember to be flexible when establishing an aim. If the change project uncovers new information that suggests changing the aim, change it.
If the aim is too ambitious, set a realistic aim that still challenges the agency to improve. If the aim is easily achieved, set a more ambitious aim that stretches the agency's capacity to improve.
Consistently Collect Data
The ability to establish consistent channels for collecting measurement data on a regular basis is a crucial part of the change process. Such channels may exist in existing data systems, but in other cases you may need to manually collect the data.
Often in the PDSA change process, it is easier to rely on manual collection for quick and rapid feedback on the success of the change. This means relying on small samples collected over short time periods to measure change progress.
For example, your agency might use reminder phone calls to reduce no-shows and your rapid measure might collect success or failure (e.g., simple tally marks) of the intervention for the next 10 clients with scheduled appointments. These results would then be compared to the baseline measure. Existing systems might be used for longer-term reporting (e.g., monthly) on the change progress. If your agency can affirmatively answer the questions in 2, you most likely have systems in place to consistently collect measurement data related to the change.
Chart Your Progress
Over time your agency will collect both pre-change (baseline) and post-change data, and the data should be shared with the change team as well as others in your organization.
The most effective tool for sharing this information is charting your progress over time using simple line graphs created in Excel. These powerful visual aids should follow one simple axiom: one graph, one message.
Charts offer Change Team members, as well as the entire organization, several key pieces of information. Charts can be used to:
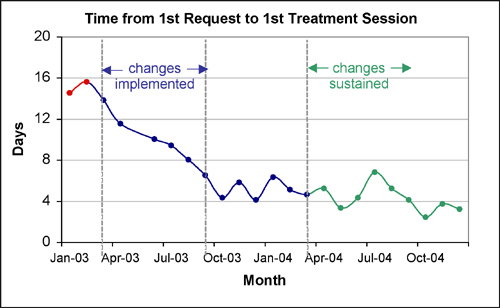
- Highlight the baseline (pre-change) data (see the red lines)
- Identify when a change was introduced in your agency (see notations)
- Visually represent the impact of individual changes over time
- Inform your agency about how it well it is sustaining the change over time.
In developing charts, your agency should consider the following points:
- Who will the measures be reported to (e.g., Executive Sponsor, Change Team, entire agency)?
- How often will the measures be reported and the charts updated (e.g., monthly, weekly)?
- What else besides the measures on these simple line charts should be reported each month ?
- To enhance the power of these line charts, the change team should also consider the following information in their progress reports:
- State the project aims so everyone is informed of what the Change Team is trying to accomplish.
- Provide measurement definitions, change targets, baselines and current progress for each measure. Remember, each line chart should present one message and one message only.
- List the tested PDSA change cycles to help inform others about what you tested and what worked, as well to seed new ideas for spreading change ideas. You can use the NIATx Change Project Template to record your PDSA change cycles and project aims, as well as to define the parameters of your change projects (one aim, one location, one level of care for one specific population ).
- Delineate the changes made on the line chart and clearly label when they were started.
- Highlight other successes, issues and challenges, key future action steps or general progress related to the Change Team.
- Identify the point in time in which the change idea was sustained within the organization (i.e., adapted and became a part of the organizational culture).
In general, the charts should be used to compare your progress over time, not to compare programs or individuals within your organization. In some instances, it does make sense to compare performance by program or counselors (e.g., no-show or continuation rates), but using this comparative approach to change behavior requires careful consideration and implementation. Comparisons should not be used in a punitive way; they should only be used to improve performance
Ask Questions
Measuring the impact of change does not stop here; in fact, it is only the beginning. The most important step in the process is to ask: What is the information telling me about change in my organization?
If change is successful, the information you have collected may tell you which intervention had the most success in meeting your aim. For example, one NIATx member sought to reduce the time from first contact to treatment (aim) by increasing professional staff availability. The change reduced the time from first call to first treatment from 18 days to 5 days, and in examining their data, the agency found that only physician and nurse practitioner availability played a role in the improvement.
Unsuccessful changes also afford your agency the opportunity to ask "Why?" Another NIATx member examined the characteristics of clients not continuing through the fourth treatment session and found that clients admitted to treatment on Fridays were more likely to drop out. The organization then stopped offering Friday admissions.